本文介绍使用Prometheus和Grafana搭建服务器监控的步骤,并简单介绍其中会涉及到的概念。

基础

术语

  • 时序数据库:Time Series Database(TSDB),顾名思义,就是存放时序数据的数据库,每条数据有时间戳,支持对该类数据的快速读写、持久化、聚合查询等操作。由于有了时间,就可以根据数据回溯,可用于监控、大数据分析、机器学习等。

    常见的TSDB有OpenTSDB、InfluxDBm、Prometheus等

  • Metrics:度量,是Prometheus中的核心概念。直接来看,度量就是一串标识符,例如http_requests_total表示所有http请求的总数

  • Tags:标签,一个metric可能会记录多种类型数据,比如http_requests_total,可能同时记录了请求的uri,此时就需要标签进行区隔,一个metric可以对应多个标签,此时它就是一个多维数据。

    1
    http_request_total{uri="ergedd/hello"}

简介

Prometheus

Prometheus是一个开源的监控报警软件,整体结构如下
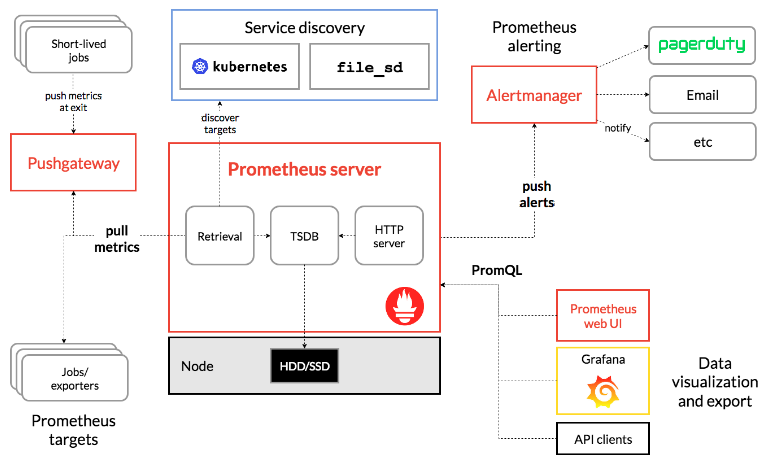
image-20200321213622180

主要组件如下

  • Prometheus Server:服务端,包含数据接收模块、时序数据库模块、Http服务模块等

    数据接收模块用于连接监控目标,监控目标可以是静态配置的单个服务,也可以是基于服务发现的得到的服务。

    时序数据库模块用于存储接收到的时序数据,并存储于硬盘

    Http服务暴露API,用于PromQL查询

    服务端工作在pull模式,即监控目标需要暴露接口,服务端通过该接口主动拉取数据。

  • Push Gateway:推送网关。用于接收监控目标主动推送的数据,同时接受服务端的数据拉取

  • Alter Manager:报警管理器。接收来自服务端的报警推送,并将报警消息发送出去

  • UI:通过PromQL查询服务端存储的数据,并通过Web页面的形式展示。一般我们不用Prometheus自带的UI模块,而是将数据接入到图形展示功能更加强大的Grafana

此外,完整的Prometheus还应包含针对特定监控目标所编写的Exporter,用于暴露监控数据,对于常规需求,会有开源公共的Exporter,对于特殊需求,可实现自定义的Exporter。

Grafana

Grafana是一个开源的数据分析和展示系统,有两个主要优点:

  • 支持各种数据库:Elasticsearch、Graphite、influxDB、Prometheus
  • 丰富的展示功能,可以图表、文字等各种方式展示数据,全凭使用者的想象力。

搭建

这里仅搭建一个最简单的系统,打通从exporter到grafana数据流,push网关和报警管理器都暂时忽略。

Prometheus Exporter

监控Linux系统状态,需要用到Node_Exporter,安装它有两种方式,一种是通过源码编译,另一种是直接下载运行,在这里

image-20200321220315917

下载合适的版本,运行,如下

1
2
3
4
5
6
7
8
9
$ ./node_exporter 
INFO[0000] Starting node_exporter (version=0.18.1, branch=HEAD, revision=3db77732e925c08f675d7404a8c46466b2ece83e) source="node_exporter.go:156"
INFO[0000] Build context (go=go1.12.5, user=root@b50852a1acba, date=20190604-16:41:18) source="node_exporter.go:157"
INFO[0000] Enabled collectors: source="node_exporter.go:97"
INFO[0000] - arp source="node_exporter.go:104"
INFO[0000] - bcache source="node_exporter.go:104"
. . . . . .
INFO[0000] - zfs source="node_exporter.go:104"
INFO[0000] Listening on :9100 source="node_exporter.go:170"

此时在本地9100端口暴露了metrics数据,访问http://localhost:9100/metrics可以获取到所有数据,数据格式是直接可读的:metric name + tag: value

1
2
3
4
5
6
7
8
9
10
11
12
13
14
15
16
17
18
$ curl http://localhost:9100/metrics

# HELP go_gc_duration_seconds A summary of the GC invocation durations.
# TYPE go_gc_duration_seconds summary
go_gc_duration_seconds{quantile="0"} 1.8648e-05
go_gc_duration_seconds{quantile="0.25"} 1.8648e-05
go_gc_duration_seconds{quantile="0.5"} 4.6304e-05
go_gc_duration_seconds{quantile="0.75"} 4.6304e-05
go_gc_duration_seconds{quantile="1"} 4.6304e-05
go_gc_duration_seconds_sum 6.4952e-05
go_gc_duration_seconds_count 2
# HELP go_goroutines Number of goroutines that currently exist.
# TYPE go_goroutines gauge
go_goroutines 7
# HELP go_info Information about the Go environment.
# TYPE go_info gauge
go_info{version="go1.12.5"} 1
. . . . . .

Prometheus Server

Prometheus在github开源,因此可直接下载最新版,这里就不再贴图了,假设已经下载好了,我们从解压后开始,在解压后的目录下可观察到有如下几个文件

1
2
$ ls
console_libraries consoles data LICENSE NOTICE prometheus prometheus.yml promtool tsdb

关注prometheus和prometheus.yml,前者是可执行文件,后者是配置文件。

在配置文件中加上exporter数据源,设置每5秒抓取一次数据,目标地址为localhost:9100,抓取路劲默认为/metrics,因此不用再指明。

1
2
3
4
5
scrape_configs:
- job_name: 'floyd_T490'
scrape_interval: 5s
static_configs:
- targets: ['localhost:9100']

启动,如下输出代表成功。

1
2
3
4
5
./prometheus --config.file=prometheus.yml
level=info ts=2020-03-21T14:18:55.601Z caller=main.go:295 msg="no time or size retention was set so using the default time retention" duration=15d
. . . . . .
level=info ts=2020-03-21T14:18:55.914Z caller=main.go:775 msg="Completed loading of configuration file" filename=prometheus.yml
level=info ts=2020-03-21T14:18:55.914Z caller=main.go:630 msg="Server is ready to receive web requests."

Prometheus Server默认监听9090端口,访问localhost:9090来到server界面,可以进行简单的查询操作。
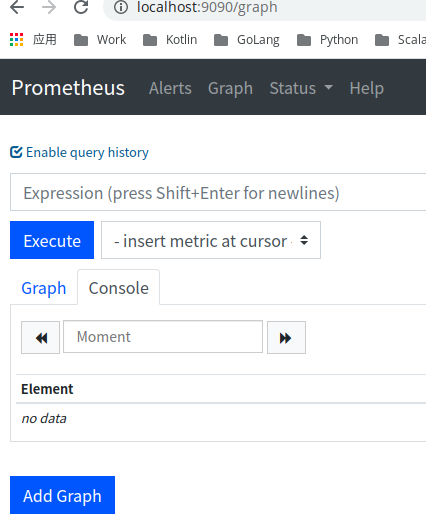
image-20200321222203367

Grafana

Grafana可以安装启动,也可以用docker启动,方便起见,我们使用Docker。

1
2
3
4
5
6
7
8
$ sudo docker run -p 3000:3000 grafana/grafana
t=2020-03-21T14:25:09+0000 lvl=info msg="Starting Grafana" logger=server version=6.6.2 commit=3fa63cfc34 branch=HEAD compiled=2020-02-20T12:03:49+0000
t=2020-03-21T14:25:09+0000 lvl=info msg="Config loaded from" logger=settings file=/usr/share/grafana/conf/defaults.ini
. . . . . .
t=2020-03-21T14:25:10+0000 lvl=info msg="Backend rendering via phantomJS" logger=rendering renderer=phantomJS
t=2020-03-21T14:25:10+0000 lvl=warn msg="phantomJS is deprecated and will be removed in a future release. You should consider migrating from phantomJS to grafana-image-renderer plugin." logger=rendering renderer=phantomJS
t=2020-03-21T14:25:10+0000 lvl=info msg="Initializing Stream Manager"
t=2020-03-21T14:25:10+0000 lvl=info msg="HTTP Server Listen" logger=http.server address=[::]:3000 protocol=http subUrl= socket=

安装成功,访问localhost:3000,可以看到登录界面,默认用户名密码为 admin / admin
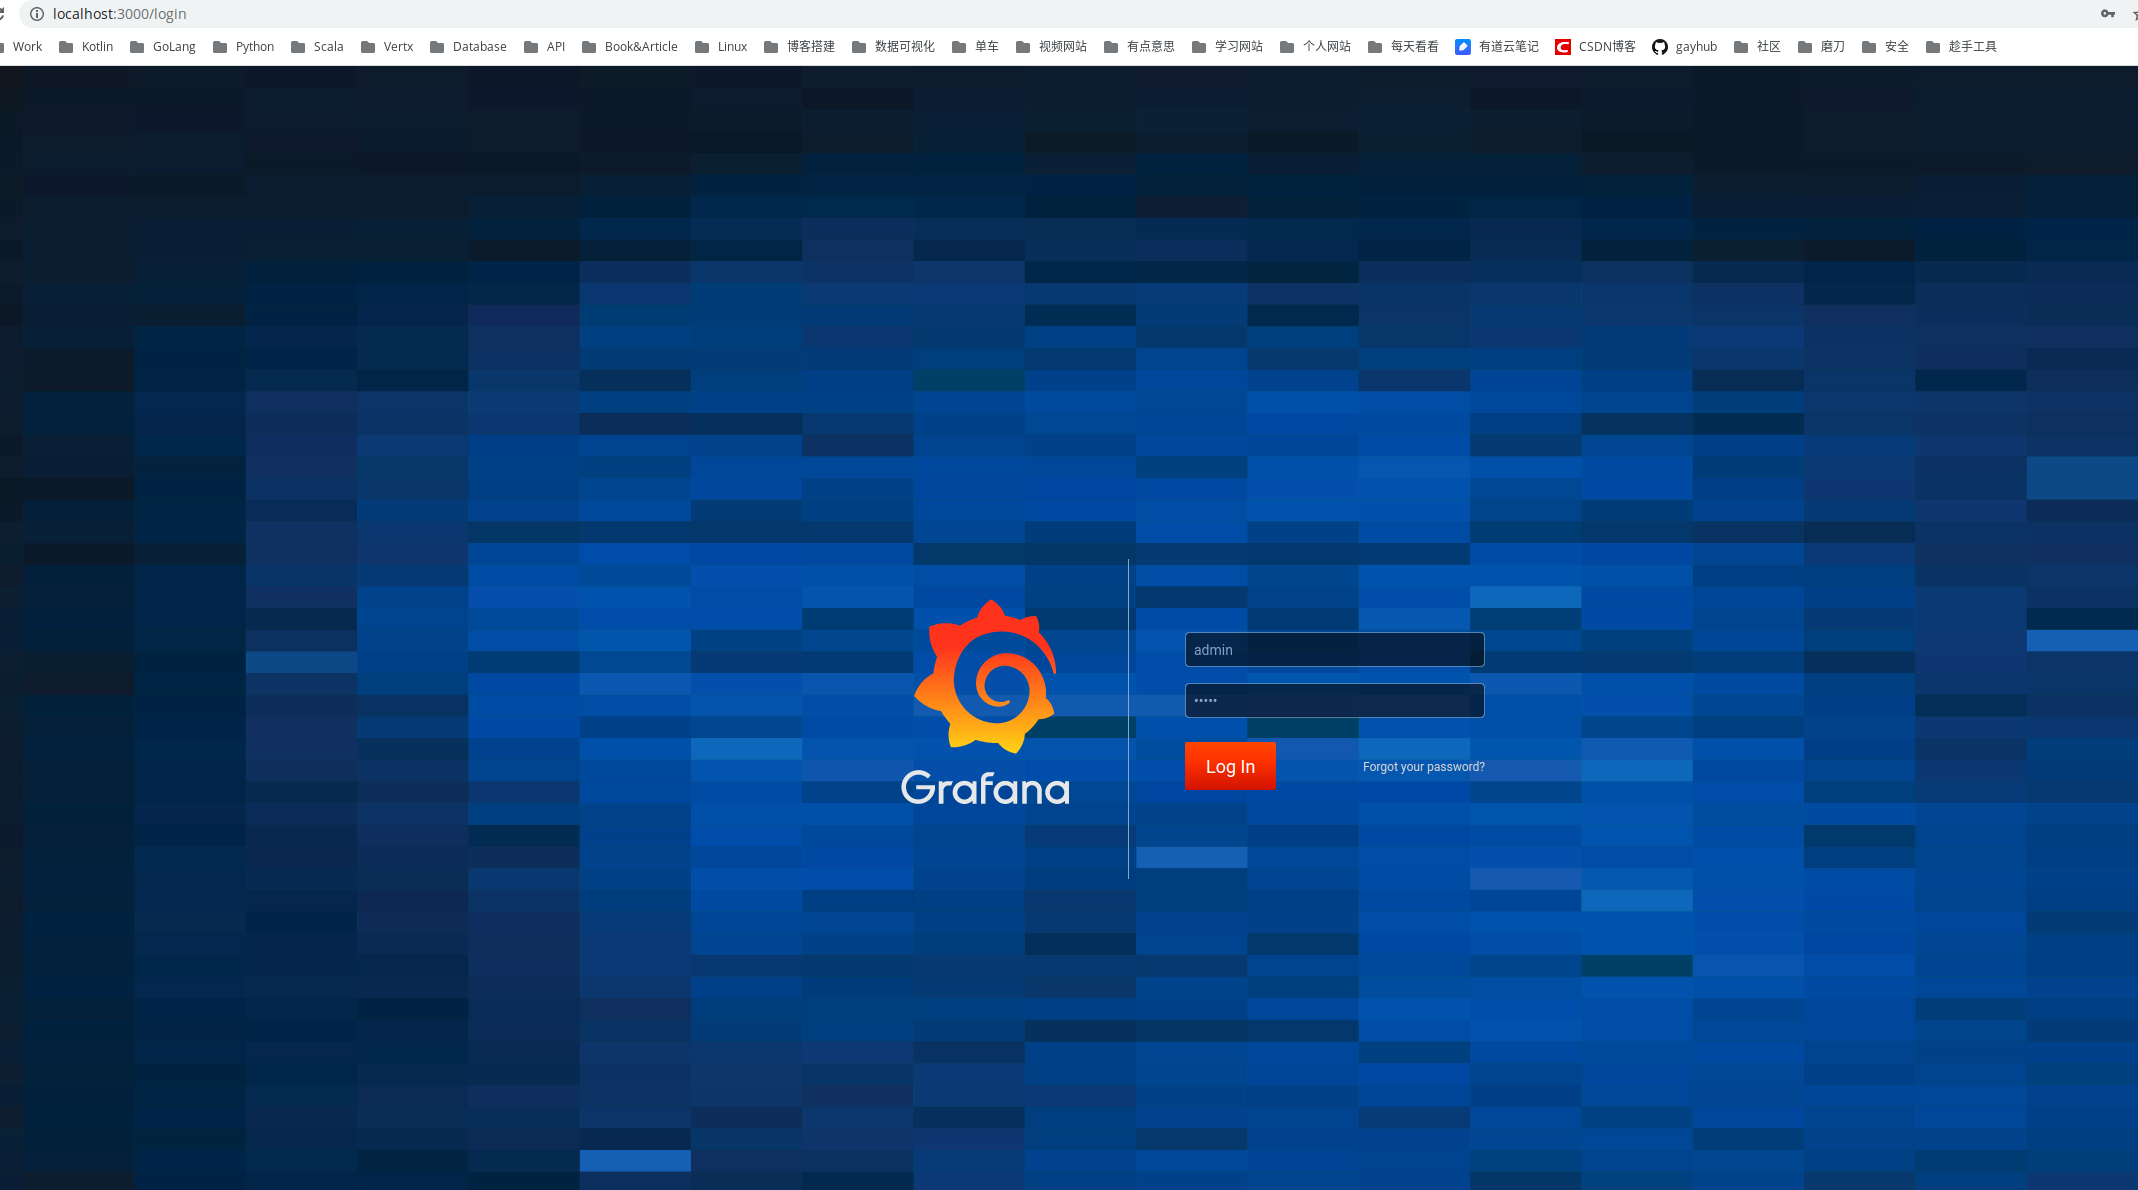
image-20200321222820888

添加Prometheus数据源

点击设置 - Data Sources - Add data source - Prometheus

来到数据源设置界面,设置URL为Prometheus Server地址http://localhost:9090,Access为Browser,即通过浏览器访问,点击Save & Test,出现下图所示的Data source is working提示即添加成功。
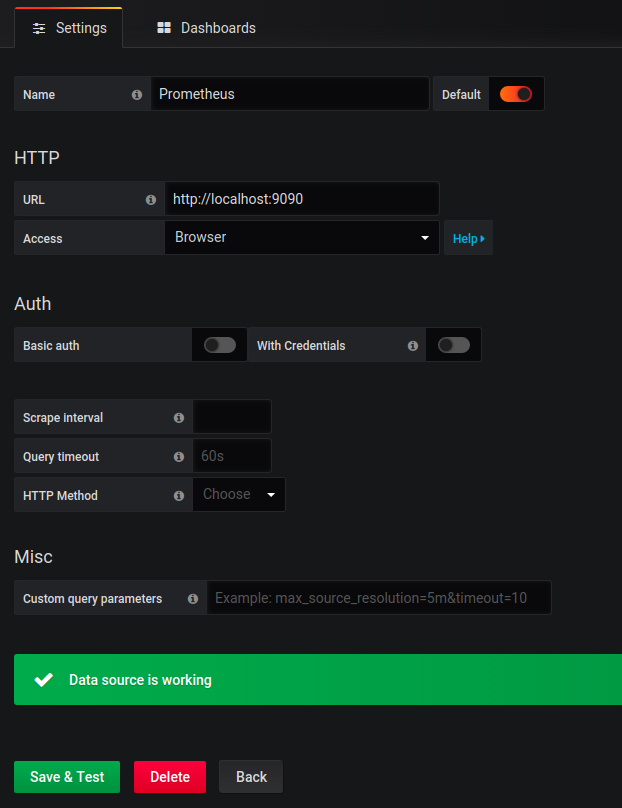
image-20200321223310983

添加Dashboard

Grafana通过Dashboard展示数据,一个Dashboard上可以有多个图表。可以自己创建,也可以将现有的导入,在Grafana Labs中,有很多分享的Dashboard,我们找一个合适的。

image-20200321223803850

点进去,复制它的ID

image-20200321223832988

回到Grafana,点击 创建 - Import ,输入上面的ID8919,加载成功可显示如下界面
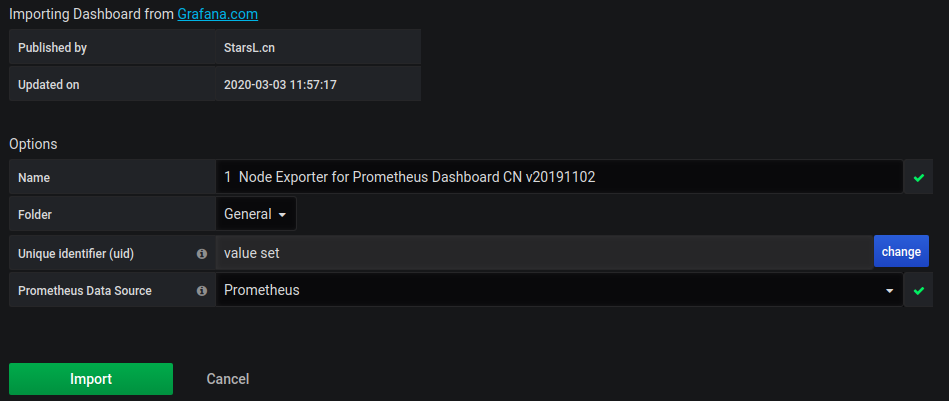
image-20200321224015143

点击导入,Awwwwwwwwwwwwwwwwwwwsome!!! 这里详细地展示了你的设备信息。
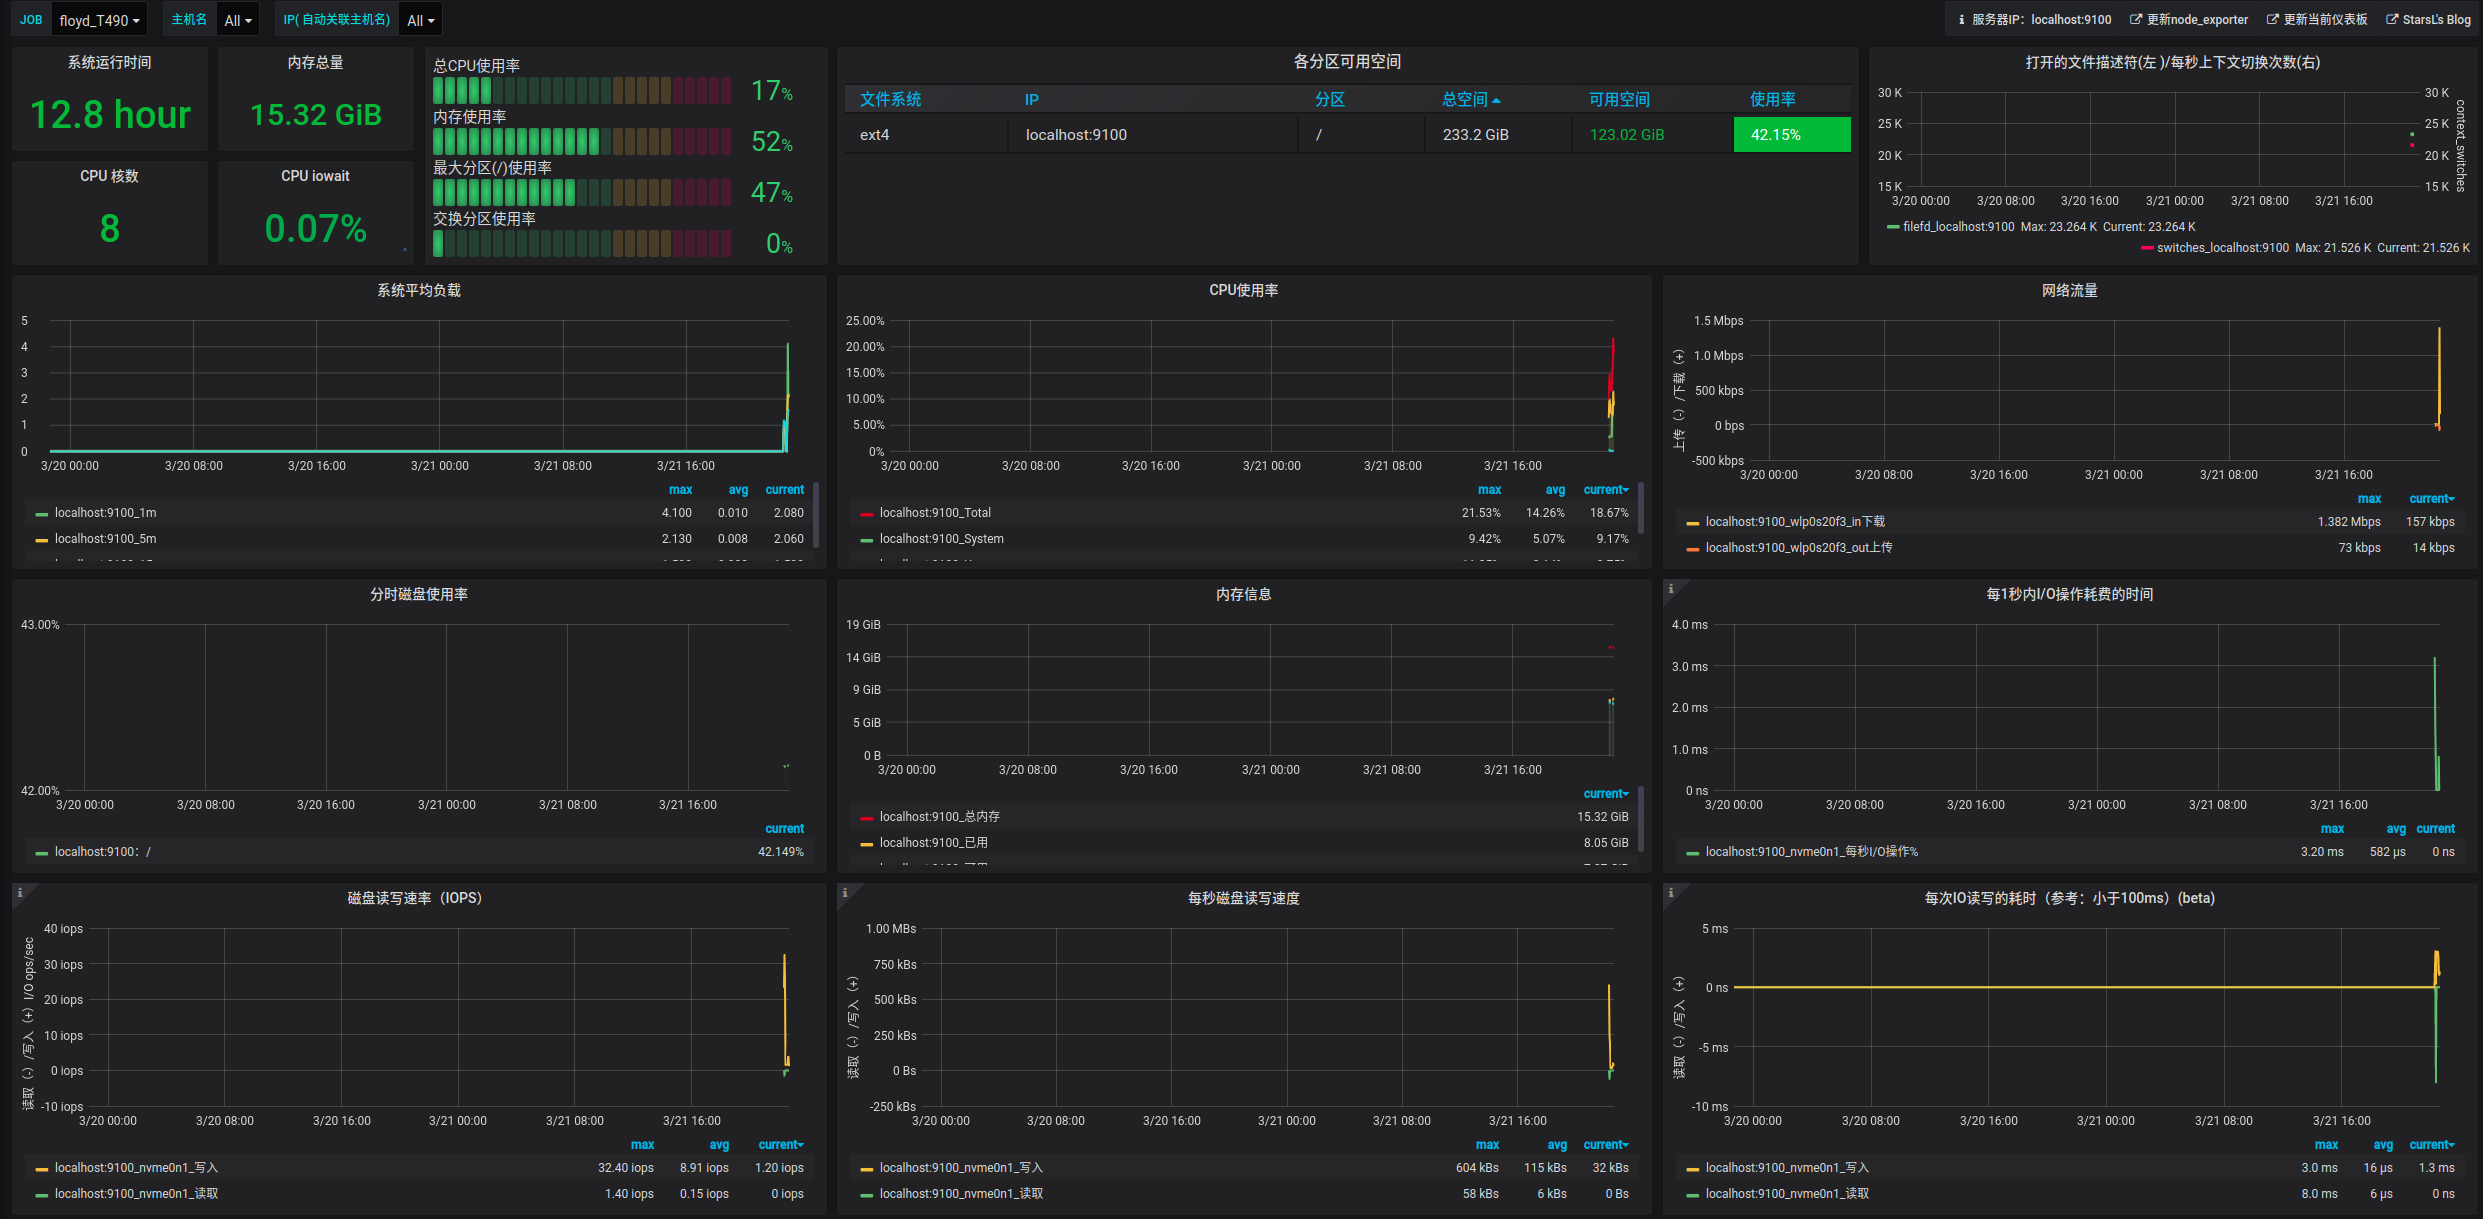
image-20200321224109344

轻微探索

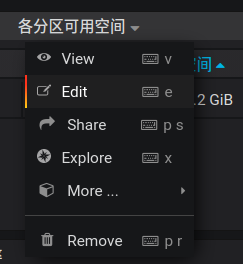
Dashboard中每个图表上方都有菜单按钮,可供我们修改

image-20200321224240393

点击View,全屏显示该图表;点击Edit,进入编辑模式。我们点编辑看看

image-20200321224349682

可以看到图表中的每个数据来自于prometheus提供的metrics,并使用PromQL进行查询的结果。自己添加图标也是如此:写PromQL - 配置图表

至此,最简单的监控服务搭建完成。

总结

本文简单搭建了Linux的监控系统,主要目的在于展示Prometheus和Grafana的工作方式,算是科普文。也介绍了基本的工作原理,给扩展留下了空间。但其它重要部分需要读者自己去探索,比如

  • Alert Manager
  • Push Gateway
  • Prometheus和其它TSDB的比较

了解更多

想要更深入了解Prometheus?

想要了解Vertx、Kubernetes如何集成Prometheus?

参考文档

  1. TSDB维基百科

  2. 时间序列数据库漫谈

  3. Awesome time series database

  4. Prometheus Blog Series (Part 1): Metrics and Labels

  5. MONITORING LINUX HOST METRICS WITH THE NODE EXPORTER

留言

⬆︎TOP